|
Friday June 6, the Labor Department announced that the economy added 217,000 jobs in May and the unemployment level remained at 6.3%. The labor market has officially recovered all of the 8.7 million jobs lost during the recession, a major milestone in the economic recovery. It was also the fourth straight month job gains have been over 200,000.
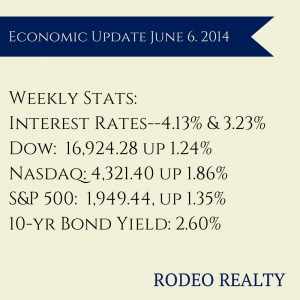
The Federal Reserve released its latest Beige book which shows that the U.S. economy strengthened over the last few months in areas that include manufacturing, construction, retail sales, and bank lending. Home sales continues to be a weaker area, partly because of the continued low inventory of available homes. Inflation remains contained. The Commerce Department says that the trade gap is the widest it has been in two years as Americans bought more imported goods and exports slowed. The trade deficit was $47.2 billion in April, up from $44.2 billion in March. Exports were down in April to $193.4 billion while imports rose by almost $3 billion to $240.6 billion. The Freddie Mac Weekly Primary Mortgage Market Survey showed that the 30-year-fixed rate was up just slightly, rising to 4.13% from 4.12% last week. The 15-year-fixed also had a minor lift, up to 3.23% from last week’s 3.21%. A year ago the 30-year fixed was at 3.91% and the 15-year was at 3.03%. Jumbo loans are running around 4.5% for 30 year terms and about 3.625% on 15 year fixed loans. The 10 year Treasury bond yield ended the week at 2.60%. It was 2.48% last Friday and 2.08% a year ago. The stock market continues to climb with all three indices notching up gains this week and closing records set by both the Dow and the S&P 500. The Dow closed at 16,924.28 up 1.24% from last week’s close of 16,717.17 The Nasdaq also had another strong week, closing at 4,321.40up 1.86% from last week’s close of 4,242.62. The S&P 500 closed at 1,949.44, up 1.35% from last week’s 1,923.57. The Commerce Department reported that U.S. construction hit its highest level in five years in April, up 0.2% to an annual rate of $953.5 billion. This was the highest level since March 2009 but was under economists’ expectations of a 0.6% gain. March’s construction spending was revised upward to show a 0.6% rise rather than the 0.2% rise previously reported. While public construction rose 0.8%, private construction was flat—a 0.1% rise on residential outlays was canceled out by a -0.1% drop in nonresidential projects. The latest data from CoreLogic showed that prices rose 10.5% in April year over year, and 2.1%from the previous month. This was the smallest annual gain in 14 months. The year-over-year gain was 11.1% in March, and 12.2% in February. These numbers are not seasonally adjusted. California saw the biggest price gain with 15.6% year over year. Home prices were up in 95 of the 100 largest metro areas but overall we are still 14.3% below the peak prices reached in April 2006. For the Los Angeles-Long-Beach-Glendale Metropolitan Area, prices were up 15.4% year over year. CoreLogic also released data showing that just 8% of mortgage holders in the Los Angeles metro area are underwater in their mortgages, lower than the national rate of 12.7%. This represents the lowest level since CoreLogic started tracking underwater borrowers in 2009. It’s early to tell, but it seems like we are seeing prices begin to flatten in some areas, while clearly continuing to rise in others. This is the first time in 3 years that I have seen signs of prices flattening out in any area in our marketplace. I would not be surprised to see more listings come on the market, as sellers may think prices have begun to top out, which is something we have not seen in recent years.
0 Comments
Leave a Reply. |
AuthorGenna Walsh Archives
February 2020
Categories
All
|


 RSS Feed
