|
Economic update for the week ending January 7, 2017
156,000 new jobs added in December - While 156,000 new jobs was slightly below the number analysts expected it marked a record 75 straight months of job gains. For 2016 the economy added over 2 million jobs. The unemployment rate ticked up from 4.6% in November to 4.7% in December as more workers began a job search. The unemployment rate has dropped more that 50% from October 2009 when the unemployment rate was 10%. Wages were the bright spot of the report. Although job growth has been steady over the last 75 months wages which usually move up as the unemployment rate drops have shown disappointing growth. In December wages were 2.9% higher than last December. The best year over year wage growth since 2009. Stocks end week up after strong job and wage report is released - All indexes hit all time record highs. At one point the DOW was just 4 points from 20,000. The DOW Jones Industrial Average closed the week at 19,963.80, up from last week's close of 19,762.60. The S&P 500 ended the week at 2,276.98, up from its close of 2,238.83 last week. The NASDAQ closed the week at 5,521.16, up from last week's close of 5,383.12. U.S. Treasury Bond yields - The 10-year U.S. Treasury Bond closed the week yielding 2.42%, down from 2.45% last Friday. The 30-year Treasury Bond yield closed the week at 3.00%, down from 3.08% last week. Mortgage rates follow bond yields, so we watch treasury bonds closely. Mortgage rates slightly lower this week - The Freddie Mac Primary Mortgage Survey released on January 5, 2017 showed that average mortgage rates from lenders surveyed for the most popular mortgage products were as follows: The 30-year fixed rate average was 4.20%. The 15-year fixed average rate was 3.44%. The 5/1 ARM average rate was 3.33%. 2016 U.S. auto sales have record breaking year in 2016 - Unexpectedly strong auto sales in December helped the auto industry break last year's record. 2016 saw 17.55 million new vehicles sold, beating 2015's record of 17.47 million vehicles. Author Syd Leibovitch
0 Comments
Citigroup has settled their toxic mortgage securities case with the Justice Department for $7 billion. This agreement is the latest in the federal governments effort to hold companies accountable that made subprime mortgages, pooled and packaged them into bonds and sold those bonds to investors. These bonds, many of which were rated AAA (the highest rating for the safest securities), turned out to be worthless or close to it. Thus earning then name toxic assets, as those who held them had such loses that many banks, investment companies, investors and even governments became insolvent.
After the DOW closed over 17,000 for the first time ever last week, US stocks fell early Tuesday morning due to a wide selloff. US stocks have been making record numbers recently. The numbers have been doing so well that it is believed the economy has made a recovery from the harsh Winter of Q1. Although there has been improvement in the jobs market and economy, it doesn’t seem to have directly impacted consumer spending.
Professionals agree that S&P 500 companies should be expected to grow in Q2. The DOW currently sits at 19,906.62, down 117.59 points or -0.69%. Tech shares took a hit, Facebook and Netflix both dropped over 3%, and Tripadvisor fell 5.5%. Shares traded reached 6.18 billion in the US which is a big jump from the June average of 5.79 active shares. The Freddie Mac Weekly Primary Mortgage Market Survey showed that the 30-year-fixed rate fell slightly again, coming in at 4.12% down from 4.14% last week. The 15-year-fixed stayed even at 3.22%. A year ago the 30-year fixed was at 4.29% and the 15-year was at 3.39%. 30-year mortgages rates dropped from 4.14% to 4.12% and 15-year rates are at 3.22%. Rates ended the week higher after the Labor Department released the June jobs report. The 30 year fixed rate is about 4.375% and the 15 year fixed is about 3.375%.
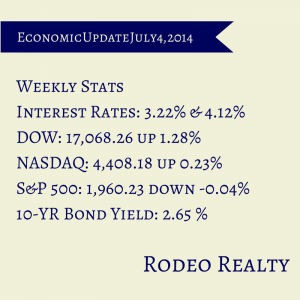
The Labor Department announced that the country added 288,000 new jobs in June. The most optimistic expectations were 215,000! This was a huge number. The nation’s unemployment rate dropped from 6.3% to 6.1% which is the lowest it has been since 2008. Job creation has been over 200,000 jobs for five straight months. The average job creation for the year has been 231,000 jobs each month. This is the highest six month average since 2006. This jobs report caused the stock markets to surge as it appears that the economy may be growing more robust than previously thought. Unfortunately, good news for stocks is bad news for interest rates! A better economy leads to higher inflation, and allows the fed to raise short term rates. It also allows the stock markets to rise which causes money movement from bonds to stocks, all of which cause mortgage rates to rise. The 10-year Treasury note yield rate ended the week at 2.65% up from last week’s close at 2.54%. It was 2.52% a year ago. The Dow closed at 17,068.26 a record high! It was up 1.28% from last week’s close of 16,851.84. The Nasdaq had another strong week, closing at 4408.18 up 0.23% from last week’s close of 4,397.93. The S&P 500 closed at 1960.23, down -0.04% from last week’s 1,960.96. Pending home resales jumped 6.1% in May, according to NAR! This is largest jump since April 2010 which was spurned by the first time buyer tax credit. The May sales were 5.2% below last May’s sales, but it is still a good sign as economists had predicted sales to be up only 1.5% for the month. One factor in the drop in sales year over year is fewer foreclosures, another is low inventory. It is an unusual time in the market. On one hand we are seeing price increases begin to stall. In many areas we are seeing homes not selling at or below the price of a previous comparable sale. Certainly this is a sign of prices beginning to flatten. On the other hand we are seeing sales activity increase slightly. There are really no statistics, but I would guess we were writing seven offers for every one accepted due to multiple offers at the beginning of the year and it is more like three written for one accepted now. That is a welcome relief! We are seeing the investors pull back a little as well, so competing with cash offers is not as common as a couple of months ago. It is much easier to be a buyer than it has been the last year or so. Especially one that needs to get a loan, as there are fewer multiple offer situations. For the sellers it is still a great time, but more attention must be paid to pricing. Most sellers are also buyers after they sell. One issue they were facing was trouble finding a home after they had sold their home. They are finding themselves much better off now that the market is stabilizing! With the Labor Department reporting job growth for June coming in at 288,000 new jobs, unemployment dropped to 6.1%, this is the lowest national average since 2008. This is great news for the future of our economy after Q1’s numbers coming out lower than predicted. Most of jobs created last month were in the services industries. Services industries had 236,000 new jobs created which is the largest gain since October 2012.
Job creation has been over 200,000 jobs for five straight months now; this is the first time numbers have been this high since the late 1990’s, which was caused by the technology boom. The average job creation for the year to date has been 231,000 jobs each month. This is the highest six month average since 2006. This jobs report has caused the stock markets to surge this morning as it appears that the economy may be growing more robust than previously thought. Unfortunately, good news for stocks is bad news for interest rates! Rates are up today by about 1/8% closing the week closer to 4.5%. They were 4.25% last Friday. A better economy leads to higher inflation, and allows the fed to raise short term rates, it also allows the stock markets to rise which causes money movement from bonds to stocks, all of which cause mortgage rates to rise. Interest rates rose slightly, and the stock market rallied on expectations of a robust gain in jobs ahead of tomorrow’s jobs report. ADP, the country’s largest payroll service, reported an estimated 281,000 jobs created in June! This is the highest number of jobs created in a month since November of 2012. This number, if it is in line with the jobs report tomorrow, shows that the economy is expanding at an increased rate. Of the 281,000 new jobs, 117,000 of them were created by companies with fewer than 50 employees. Mid-sized businesses added 115,000 jobs and large companies with over 500 employees only attributed 49,000 new jobs. Mid-size companies haven’t created that many jobs in over 6 years. The first quarter 2014 jobs and GDP numbers were terrible, but in the second quarter the job numbers were quite good. January to March of this year had a total of 505,000 new jobs compared to 680,000 jobs created from April to June. The second quarter GDP numbers will not be out for a couple of months, but that number is expected to be drastically better than the first quarter as was job gains! Interest rates dropped slightly this week following a disappointing 1st quarter GDP Report. Q1 experienced a record size shrink in economy. The government had predicted a -1% decline, but the real number ended up being -2.9%. This is the largest shrink in the economy since the recession in the Q1 of 2009, when the economy shrunk by 5.4%. The blame of this economic shrink is being put on an unforgiving winter season that shut down factories, caused major disruptions in shipping, and kept American’s away from malls and car dealerships. Housing construction also slumped. Most analysts believe the economy will bounce back and expand at a healthy annual rate of about 3% during the second half of this year.
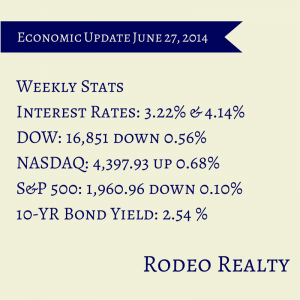
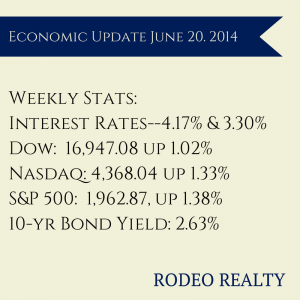
The Freddie Mac Weekly Primary Mortgage Market Survey showed that the 30-year-fixed rate fell slightly, coming in at 4.14% down from 4.17% last week. The 15-year-fixed also dropped, down to 3.22% from last week’s 3.30%. A year ago the 30-year fixed was at 4.46% and the 15-year was at 3.50%. Mortgages for loans over $417,000 are more like 4.25% for 30 year and 3.375% for 15 year terms. The 10-year Treasury note yield rate ended the week at 2.54% after ending last week at 2.63%. It was 2.49% a year ago. The Dow closed at 16,851.84 down -0.56% from last week’s close of 16,947.08 The Nasdaq had another strong week, closing at 4,397.93 up 0.68% from last week’s close of 4,368.04. The S&P 500 closed at 1,960.96, down -0.10% from last week’s 1,962.87. The unemployment rate in Los Angeles County fell to 8.2% in May from 8.3% in April. it was 10% one year ago. A total of 2,400 net new jobs were added in the county. Countywide around 11,000 more people entered the workface in May and 15,000 reported finding jobs. The state unemployment rate dropped to 7.6% from 7.8%. The Conference Board’s consumer confidence index rose to 85.2 from 83.5 in May, the highest reading since January 2008. Economists surveyed by Bloomberg expected a reading of 83.5. Consumers are optimistic about current conditions. The number of those who stated business conditions are good rose to 23% from 21.1% while those saying conditions are bad fell to 22.8% from 24.6%. More consumers also believe jobs are becoming easier to get. The Thomson Reuters/University of Michigan survey’s consumer sentiment index for June was also up, rising to 82.5 from 81.9 in May. Fannie Mae’s monthly economic outlook predicts that home sales will likely fall this year for the first time in four years. Existing home sales fell for the first quarter of the year but were up in both April and May. However for the first four months of the year existing home sales were down -7% year over year and new home sales were down -3%. Fannie Mae is predicting that total home sales in 2014 will be down -1.4% with new home sales up 11.3% and existing home sales down -2.4%. They are predicting mortgage rates will rise only slightly to around 4.3% for a 30-year fixed-rate mortgage. The National Association of Realtors® reported that all four regions of the country experienced sales gains compared to a month earlier. Total existing home sales rose 4.9% to a seasonally adjusted rate of 4.89 million in May, up from 4.66 million in April but still -5% below the 5.15 million reported in May 2013. The 4.9% monthly gain was the highest seen since August 2011.Total housing inventory is also on the rise, up 2.2% to 2.28 million, a 5.6 month supply which is 6% higher than a year ago when 2.15 million existing homes were available. The median existing home price was $213,400, which is 5.1% above May 2013. Distressed homes accounted for 11% of May sales, down from 18% in May 2013. The median time on market for all homes was 47 days in May, down from 48 days in April; it was 41 days on market in May 2013. Existing-home sales in the West rose 0.9% to an annual rate of 1.09 million in May, and are -11.4% below a year ago. The median price in the West was $297,500, which is 8.4% above May 2013. According to the U.S. Census Bureau and the Department of Housing and Urban Development sales of new single-family houses in May 2014 were at a seasonally adjusted annual rate of 504,000. This is 18.6% above the revised April rate of 425,000 and is 16.9% above the May 2013 estimate of 431,000. The median sales price of new houses sold in May 2014 was $282,000. The seasonally adjusted estimate of new houses for sale at the end of May was 189,000. This represents a supply of 4.5 months at the current sales rate The California Association of Realtors® reported that the share of equity sales – or non-distressed property sales – rose in May to 89.2% up from 88.4% in April and from 78% in May 2103. May is the 11th straight month that equity sales have been more than 80% of total sales. California pending home sales fell in May, with the Pending Home Sales Index (PHSI)* dropping -3.4% from a revised 114.1 in April to 110.1 in May, based on signed contracts and down -10.6% from the revised 123.2 index recorded in May 2013. The year-over-year decline in the PHSI was the first double-digit decline in three months. In Los Angeles County, distressed sales made up 11% of all sales, down from 12% in April and from 23% in May 2013. The S&P/Case-Shiller Home 20-City Composite Index for April saw a gain of 10.8% year over year and 0.2% from the previous month. Both of these numbers were below what was predicted. Los Angeles saw prices rise 14% year over year and 0.7% from March. We are now seeing some flattening of prices across the region. While prices are substantially higher than they were a year ago we are seeing homes priced at or below the very highest sales beginning to sit. It is time to pay more attention to pricing! We have seen virtually every sale be a record price for a couple of years. At least for now that appears to be ending! This will be a relief to buyers. Get in contact with the buyers that lost out on so many homes due to multiple offers. Some have given up. Now it may be their time! The Freddie Mac Weekly Primary Mortgage Market Survey showed that the 30-year-fixed rate fell slightly, coming in at 4.17% down from 4.20% last week. The 15-year-fixed moved just a little, down to 3.30% from last week’s 3.31%. A year ago the 30-year fixed was at 3.93% and the 15-year was at 3.04%. After The release of the CPI report rates finished the week slightly higher. Rates are more like 4.25 for 30 year fixed conforming and about the same for jumbo. 15 year are around 3.375%. The 10 year Treasury bond yield ended the week at 2.63%. It was 2.61% last Friday and 2.41% a year ago. The best indicator of inflation the CPI Index for May was released earlier in the week. May’s rise in consumer prices showed 0.3 percent increase from April. This was double what was expected and the largest monthly increase since February 2013. With tensions escalating in Iraq, a major world oil producer, inflation is likely to push higher in the coming months. In the 12 months through May, consumer prices increased 2.1 percent, the biggest gain since October 2012. That followed a 2.0 percent rise in the period through April, marking the first back-to-back months in which the year-on-year CPI had risen at least 2 percent since early 2012. Stripping out food and energy prices, the so-called core CPI rose 0.3 percent, the largest increase since August 2011. The Federal Open Market Committee met this week and the Fed announced that it plans to continue thetaper of the bond-buying program, cutting back by another $10 billion. This program known asQE3 has been tapered down significantly and The Fed plans to end all Treasury Bond and Mortgage purchases by the end of the year. This program brought down long term interest rates. The Fed also announced that they plan to on keeping the federal fund rates near zero until mid 2015. This will keep down short term rates. Fed Chair Janet Yellen has indicated that interest rates will remain low even after the Fed completely winds down its stimulus program. In remarks this week, Yellen pointed out that unemployment is still high and many are underemployed. She also shrugged off the CPI index increase as “noise” due to tensions in Iraq causing a rise in energy costs. She stated that real inflation is still below the 2% objective rate. All three major stock indexes had a great week with the Dow and S&P 500 hitting records and the Nasdaq reaching a 14-year high. The Dow closed at 16,947.08 up 1.02% from last week’s close of 16,775.74. The Nasdaq also finished strong, closing at 4,368.04 up 1.33% from last week’s close of 4,310.65. The S&P 500 closed at 1,962.87, up 1.38% from last week’s 1,936.16. Homebuilder confidence appears to be gaining ground again. The latest numbers from the National Association of Home Builder/Wells Fargo builder sentiment index rose to 49 in June, the highest since January and up from 45 in May. Readings below 50 indicate that builders see sales conditions as poor rather than good but builder are now the most confident they have been since January as they see more potential buyers shopping for new homes. This time last year, the index rose above 50 for the first time since the beginning of the housing recession. For the West alone, the June reading is at53, indicating that builders see good sales conditions for new homes. The latest report from the Census Bureau showed that housing starts were down in May from the previous month but were higher than the year before. Single-family housing starts were down -5.9% from April but were up 4.7% from a year ago. Single-family housing completions in May were at a rate of 618,000; this is 2.1% above the revised April rate of 605,000. The California Association of Realtors® reported closed escrow sales of existing, single-family detached homes in California totaled a seasonally adjusted annualized rate of 391,030 units in May which was -0.6% below the revised 393,480 in April and down -9.5% from a revised 432,140 in May 2013. This was the tenth straight decline on a month-over-month basis. May’s median price increased 3.7% from April’s median price of $449,360 to $465,960 and was up11.7 % from the revised $417,140 recorded in May 2013. The statewide median home price has increased year over year for the previous 27 months. Housing inventory was unchanged in May, with the available supply of existing, single-family detached homes for sale holding steady at 3.6 months. The index was 2.6 months in May 2013. The median number of days it took to sell a single-family home fell to 31.6 days in May, down from 33.8 days in April but up from 27.1 days in May 2013. For Los Angeles County alone the median price rose to $411,640 up 1.2% from the previous month’s $406,750, and up 12.5% from May 2013’s $365,990. Sales were up 6.9% from April but down -12.2% from May 2013. In Los Angeles County, the amount of inventory was 3.6 months up from 3.5 months in April and 2.5 months in May 2013. The median time on market was 38.7 days, down from 39.5 days in April but up from 27.9 months last April. We are beginning to see some flattening of prices in many areas after a large run up so far this year. It is not unusual to see prices begin to flatten this time of year. We usually see the largest price gains in the Spring and I’d expect to see large gains again beginning next February lasting through May or June. Nevertheless we are seeing some price pressure in many areas where some homes are just too high and are beginning to sit. Don’t get me wrong we are still seeing plenty of multiple offers on well priced homes! However, on homes that are priced above previous sales or at the price of the very highest sale we are seeing those homes sit! Friday June 6, the Labor Department announced that the economy added 217,000 jobs in May and the unemployment level remained at 6.3%. The labor market has officially recovered all of the 8.7 million jobs lost during the recession, a major milestone in the economic recovery. It was also the fourth straight month job gains have been over 200,000.
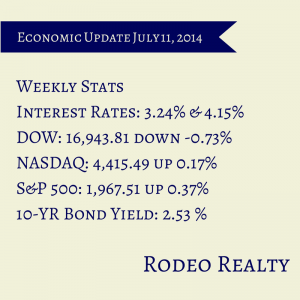
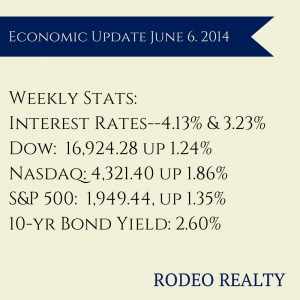
The Federal Reserve released its latest Beige book which shows that the U.S. economy strengthened over the last few months in areas that include manufacturing, construction, retail sales, and bank lending. Home sales continues to be a weaker area, partly because of the continued low inventory of available homes. Inflation remains contained. The Commerce Department says that the trade gap is the widest it has been in two years as Americans bought more imported goods and exports slowed. The trade deficit was $47.2 billion in April, up from $44.2 billion in March. Exports were down in April to $193.4 billion while imports rose by almost $3 billion to $240.6 billion. The Freddie Mac Weekly Primary Mortgage Market Survey showed that the 30-year-fixed rate was up just slightly, rising to 4.13% from 4.12% last week. The 15-year-fixed also had a minor lift, up to 3.23% from last week’s 3.21%. A year ago the 30-year fixed was at 3.91% and the 15-year was at 3.03%. Jumbo loans are running around 4.5% for 30 year terms and about 3.625% on 15 year fixed loans. The 10 year Treasury bond yield ended the week at 2.60%. It was 2.48% last Friday and 2.08% a year ago. The stock market continues to climb with all three indices notching up gains this week and closing records set by both the Dow and the S&P 500. The Dow closed at 16,924.28 up 1.24% from last week’s close of 16,717.17 The Nasdaq also had another strong week, closing at 4,321.40up 1.86% from last week’s close of 4,242.62. The S&P 500 closed at 1,949.44, up 1.35% from last week’s 1,923.57. The Commerce Department reported that U.S. construction hit its highest level in five years in April, up 0.2% to an annual rate of $953.5 billion. This was the highest level since March 2009 but was under economists’ expectations of a 0.6% gain. March’s construction spending was revised upward to show a 0.6% rise rather than the 0.2% rise previously reported. While public construction rose 0.8%, private construction was flat—a 0.1% rise on residential outlays was canceled out by a -0.1% drop in nonresidential projects. The latest data from CoreLogic showed that prices rose 10.5% in April year over year, and 2.1%from the previous month. This was the smallest annual gain in 14 months. The year-over-year gain was 11.1% in March, and 12.2% in February. These numbers are not seasonally adjusted. California saw the biggest price gain with 15.6% year over year. Home prices were up in 95 of the 100 largest metro areas but overall we are still 14.3% below the peak prices reached in April 2006. For the Los Angeles-Long-Beach-Glendale Metropolitan Area, prices were up 15.4% year over year. CoreLogic also released data showing that just 8% of mortgage holders in the Los Angeles metro area are underwater in their mortgages, lower than the national rate of 12.7%. This represents the lowest level since CoreLogic started tracking underwater borrowers in 2009. It’s early to tell, but it seems like we are seeing prices begin to flatten in some areas, while clearly continuing to rise in others. This is the first time in 3 years that I have seen signs of prices flattening out in any area in our marketplace. I would not be surprised to see more listings come on the market, as sellers may think prices have begun to top out, which is something we have not seen in recent years. |
AuthorGenna Walsh Archives
February 2020
Categories
All
|





 RSS Feed
